 ultimate-guide
How to Read HPLC Chromatograms: A 2026 Guide
Table of Contents
- What a Chromatogram Actually Shows You
- Reading Peaks: Area, Height, and Baseline
- Interpreting HPLC Peak Integration Correctly
- Common HPLC Artifacts in Peptide Analysis
- How to Verify Peptide Purity from a Chromatogram
- Troubleshooting Chromatogram Errors Step by Step
- Conclusion
- Frequently Asked Questions
Last Updated: September 11, 2026
What a Chromatogram Actually Shows You
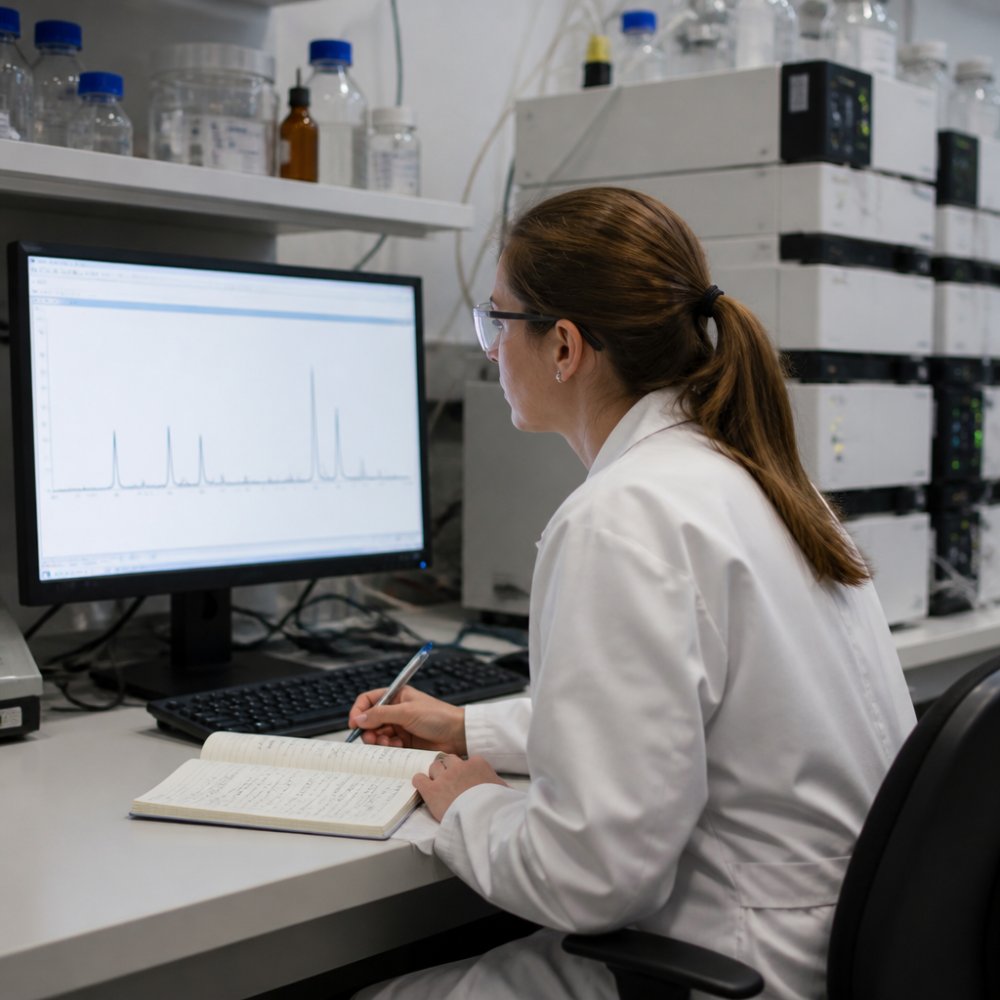
A chromatogram plots detector signal against time as compounds elute from an HPLC column. Learning how to read HPLC chromatograms starts with one idea: every peak is a compound leaving the column, and where it appears tells you what it might be.
BlueWaveCompound provides premium, research-grade peptides, and every batch is third-party lab tested and accompanied by a Certificate of Analysis. A chromatogram is not a picture of your sample. A chromatogram is not a picture of your sample. It is a record of how your sample behaved under one specific set of conditions, and those conditions matter as much as the peaks.
Below, we'll walk through each axis, then show you how to spot the artifacts that wreck peptide data.
The X-Axis: Time and Retention Time
The X-axis measures time in minutes from injection. Retention time is the interval between injection and the apex of a given peak, and it is the primary qualitative clue in any separation. It shifts when the mobile phase, stationary phase, column temperature, or flow rate changes. A peak that moves two-tenths of a minute between runs is usually system noise; consistent retention time is one of the strongest signs your method is stable.
The Y-Axis: Detector Response and Signal-to-Noise Ratio
The Y-axis shows detector response in absorbance, fluorescence, or refractive index units depending on your detector. The signal-to-noise ratio compares your analyte peak to baseline fluctuation. A ratio of 10:1 is the conventional threshold for reliable quantitation; below 3:1, you are looking at noise (peer-reviewed research).
Reading Peaks: Area, Height, and Baseline
Peak area is the total detector response integrated across the peak; peak height is the maximum response at the apex. The baseline is the detector response recorded when no analyte is eluting. A flat, stable baseline makes integration straightforward; a drifting or noisy one makes every downstream number suspect.
Peak Area vs. Peak Height for Quantitation
Use peak area for quantitation in almost every case: it is proportional to the total mass of analyte passing through the detector, making it far more tolerant of small changes in peak shape. Peak height holds up better when peaks co-elute and integration cannot cleanly separate them.
Baseline Drift, Noise, and What They Signal
Baseline drift is a gradual upward or downward slope across the run, usually pointing to column bleed, a temperature change, or a mobile phase slowly equilibrating. High-frequency noise suggests lamp aging, a dirty flow cell, or air in the system. Neither is about your peptide, but both distort the numbers you report.
| Symptom | Likely Cause | Practical Fix |
|---|---|---|
| Gradual upward drift | Column bleed or temperature change | Equilibrate longer; check column age |
| Gradual downward drift | Mobile phase equilibration | Allow full equilibration before injection |
| High-frequency noise | Lamp aging or air in system | Purge lines; check lamp hours |
| Sporadic spikes | Bubble in flow cell | Degas mobile phase; inspect fittings |
Interpreting HPLC Peak Integration Correctly
Interpreting HPLC peak integration means drawing the baseline under each peak and measuring the area the detector signal encloses. Software does this automatically, but its settings decide whether your numbers are trustworthy.
The Integration Settings That Change Your Numbers
Four parameters drive almost every integration decision in chromatography data software (CDS) platforms such as Empower, Chromeleon, OpenLab CDS, and LabSolutions.
- Slope sensitivity (sometimes called threshold or tangent skim sensitivity): the rate of change in detector signal the software must see before it calls a rise a peak. Lower it and the software integrates noise; raise it and small real peaks disappear into the baseline.
- Peak width: tells the software how wide a peak is expected to be, setting the window it uses to find each peak's start and end. Set it narrower than your actual peaks and the software chops off peak tails; set it wider and it merges peaks that should be separate.
- Baseline mode (valley-to-valley, exponential skim, or tangent skim): decides how the baseline is drawn when peaks are not fully resolved. Valley-to-valley drops to the lowest point between two peaks; tangent skim follows the first peak's tail under the second. The choice changes the area split between co-eluting peaks.
- Minimum area or height threshold: a floor below which the software ignores a peak entirely. Set it too high and you silently delete impurity peaks from your purity calculation.
To see the effect, integrate one data file with default settings, then reintegrate with slope sensitivity doubled and peak width halved. Most analysts find the main-peak percentage moves, sometimes by more than a point, without any change to the chemistry.
Why Default Settings Fail for Peptide Work
Default integration settings in most CDS platforms are tuned for small-molecule methods with sharp, symmetrical peaks. Peptide gradients produce broader peaks, more baseline rise from increasing organic content, and impurity peaks close to the main peak; applying small-molecule defaults is how labs under-report purity. Document the settings you chose and apply them to every batch you compare.
Reading the Integration Report
Every CDS platform produces an integration report alongside the chromatogram. Check these columns before trusting a purity number:
| Report column | What it tells you | Red flag |
|---|---|---|
| Retention time | Where the peak apex landed | Drift across the run |
| Area | Integrated detector response | Area that changes between identical injections |
| Height | Maximum signal at apex | Height far out of proportion to area |
| Area % | Share of total integrated area | Sums to less than 100% with no explanation |
| USP tailing factor (Tf) | Peak symmetry at 5% height | Tf above roughly 2 |
| Resolution (Rs) | Separation from the nearest peak | Rs below 1.5 |
| Theoretical plates (N) | Column efficiency | N dropping run to run |
If the area % does not match the visual trace, check the integration settings first, not the sample.
Common HPLC Artifacts in Peptide Analysis
Peptide separations produce a recognizable set of artifacts, and knowing them by sight saves hours of confusion. The three most common are ghost peaks, tailing, and fronting. Ghost peaks appear in blank injections, meaning they come from the system rather than your sample: carryover, contaminated mobile phase, or material leaching from seals and tubing. Tailing trails off slowly on the right side; fronting is the mirror image.
Ghost Peaks, Tailing, and Fronting
Tailing usually traces back to secondary interactions between the analyte and residual silanol groups on the stationary phase, and gets worse at low pH and with basic peptides. Fronting most often means column overload; diluting the sample and re-running is the fastest diagnostic test. Ghost peaks waste the most time because they send researchers looking for a sample problem that does not exist.
How to Verify Peptide Purity from a Chromatogram
Peptide purity from a chromatogram is the percentage of total integrated peak area accounted for by the main peak. A purity figure is only meaningful when the integration settings, wavelength, and method are stated alongside it. The practical sequence:
- Confirm the method details: column, mobile phase, gradient, flow rate, and detection wavelength
- Check the blank injection for ghost peaks before evaluating the sample
- Inspect the baseline for drift or noise across the full run
- Review the integration settings and confirm they match the method
- Calculate main peak area as a percentage of total integrated area
- Look for impurity peaks that sit close to the main peak and may be merged
- Compare retention time against a reference standard run under identical conditions
That last step matters more than most people expect. Purity percentage tells you how much of the detected material is your main peak. It does not tell you that the main peak is the compound you ordered.
For a broader look at what a complete purity assessment involves, the guidance on analytical method validation from the International Council for Harmonisation sets out the parameters regulators expect to see documented.
Troubleshooting Chromatogram Errors Step by Step
The skill that saves time is recognizing a bad trace by its shape and knowing which cause to chase first. Here are the anomalies you will meet most often and the fastest diagnostic path for each.
A Field Guide to Bad Chromatograms
Ghost peaks. Peaks that appear in a blank injection, meaning they come from the system rather than the sample: carryover, contaminated mobile phase, or material leaching from seals, tubing, or the needle. Diagnostic: run a blank. Fix: add a needle wash, replace mobile phase, or run a longer gradient wash.
Tailing. The peak trails off slowly on the right side, with a tailing factor (Tf) above roughly 2. Usually caused by secondary interactions between the analyte and residual silanol groups, worse at low pH and with basic peptides. Diagnostic: inject at a higher buffer pH or with a competing modifier. Fix: switch to a base-deactivated column or adjust pH.
Fronting. The mirror image of tailing, with a steep right edge and a drawn-out left side. Almost always column overload. Diagnostic: dilute the sample and re-run; if the shape sharpens, overload was the cause. Fix: reduce injection volume or concentration, or use a larger-bore column.
Split or shouldered peaks. A single peak with a notch or second apex, pointing to co-elution, a partially blocked frit, or a void at the column head. Diagnostic: compare against a reference standard run under identical conditions. Fix: adjust the gradient or replace the column.
Negative peaks. A dip below the baseline, usually meaning the analyte absorbs less than the mobile phase at the detection wavelength, or a refractive index mismatch in the flow cell. Diagnostic: check the wavelength against the analyte's absorbance maximum. Fix: change wavelength or mobile phase composition.
Baseline drift. A gradual upward or downward slope across the run. Upward drift points to column bleed or a temperature change; downward drift to a mobile phase still equilibrating. Diagnostic: run a blank gradient and watch the baseline. Fix: equilibrate longer, check column age, or verify oven stability.
High-frequency noise. Rapid, low-amplitude fluctuation across the trace, suggesting lamp aging, a dirty flow cell, or air in the system. Diagnostic: purge the lines and check lamp hours. Fix: replace the lamp, flush the flow cell, or degas the mobile phase.
Sporadic spikes. Isolated sharp jumps. Almost always a bubble in the flow cell or a loose fitting. Diagnostic: inspect fittings and degas the mobile phase. Fix: tighten connections and use an inline degasser.
The Diagnostic Sequence
Work through these in order, because most errors have more than one possible cause and the cheap checks come first.
- Run a blank injection. If peaks appear, the problem is in your system or mobile phase, not your sample.
- Check the baseline before the first peak. Drift or noise here points to equilibration, lamp, or flow cell issues.
- Examine peak shape against the field guide above. Tailing, fronting, splitting, and negative peaks each point to a specific cause.
- Compare retention time to your reference. A shift across the whole run points to method or mobile phase problems; a shift in one peak points to that compound.
- Review integration settings. Confirm slope sensitivity and peak width suit your peak widths, then reintegrate and compare.
- Re-inject the same sample. If the trace changes between identical injections, you have a system reproducibility problem, not a sample problem.
Step 6 is the one people skip, and the fastest way to separate a real result from an instrument that needs attention.
For a broader look at what a complete purity assessment involves, the guidance on analytical method validation from the International Council for Harmonisation sets out the parameters regulators expect to see documented. BlueWaveCompound supplies research-grade peptides with third-party lab testing and a Certificate of Analysis for every batch, so the chromatogram you receive comes with the documentation needed to evaluate it properly. Learn more at https://bluewavecompounds.com.
Conclusion
Reading a chromatogram well comes down to discipline: check the baseline, run the blank, document your integration settings, and never report a purity figure without the method behind it. The peaks will tell you what happened, but only if you give them a clean system to show up in.
BlueWaveCompound supplies research-grade peptides with third-party lab testing and a Certificate of Analysis for every batch, so the chromatogram you receive comes with the documentation needed to evaluate it properly. Every batch is tested for high purity, and our lyophilized format supports the stability that reproducible experiments depend on. Get started with BlueWaveCompound and give your lab materials you can trust for reproducible experiments.
Frequently Asked Questions
How do you calculate peptide purity from an HPLC peak area?
Divide the area of the main peptide peak by the total area of all peaks in the chromatogram, then multiply by 100. Most labs set a purity threshold of 95% or higher for research-grade material. Run the sample at multiple wavelengths (typically 214 nm and 220 nm for peptides) to catch impurities that absorb differently. A Certificate of Analysis from a third-party lab, like those provided with compounds from BlueWaveCompound, gives you the purity figure already calculated from validated methods.
What does a baseline shift indicate in an HPLC chromatogram?
A drifting or shifting baseline usually points to gradient changes, column temperature fluctuations, or detector lamp instability. In gradient elution, a mild upward slope is expected as mobile phase composition changes. A sharp step or sudden drop often means an air bubble, a leak, or a wavelength change mid-run. Check your mobile phase degassing and column equilibration time first. If drift persists, run a blank injection to separate instrument issues from sample-related ones.
How do you distinguish between impurities and the main peptide peak?
The main peptide peak is typically the tallest and most symmetric, with a retention time that matches your reference standard. Impurity peaks tend to be smaller, may show tailing or fronting, and often elute close to the main peak. Use a calibration curve and internal standard to confirm identity. Diode array detection helps: compare UV spectra across peaks. For critical work, spiking the sample with a known standard and watching which peak grows confirms the main component.
Why is retention time critical when reading HPLC results?
Retention time is the primary qualitative identifier for a peak. If your peptide should elute at 12.4 minutes under your method conditions, a peak at 12.4 minutes with the right area strongly suggests it is your compound. Shifts in retention time across runs can signal column degradation, mobile phase preparation errors, or temperature changes. Consistent retention time is one of the clearest signs that your chromatographic separation is under control.